Exponential Relationships
I am going to show an exponential relationship in three different ways. The relationship I am showing could come from bunny rabbits reproducing. The initial population of the rabbits would be two rabbits and as the rabbits start to breed the number of total rabbits would be an exponential relationship.
|
This is an exponential graph. I can tell because there is a starting point on the y-axis and the graph increases from there. They y-intercept is two and then the growth between each point doubles each time. This doubling is the growth factor of the relationship.
|
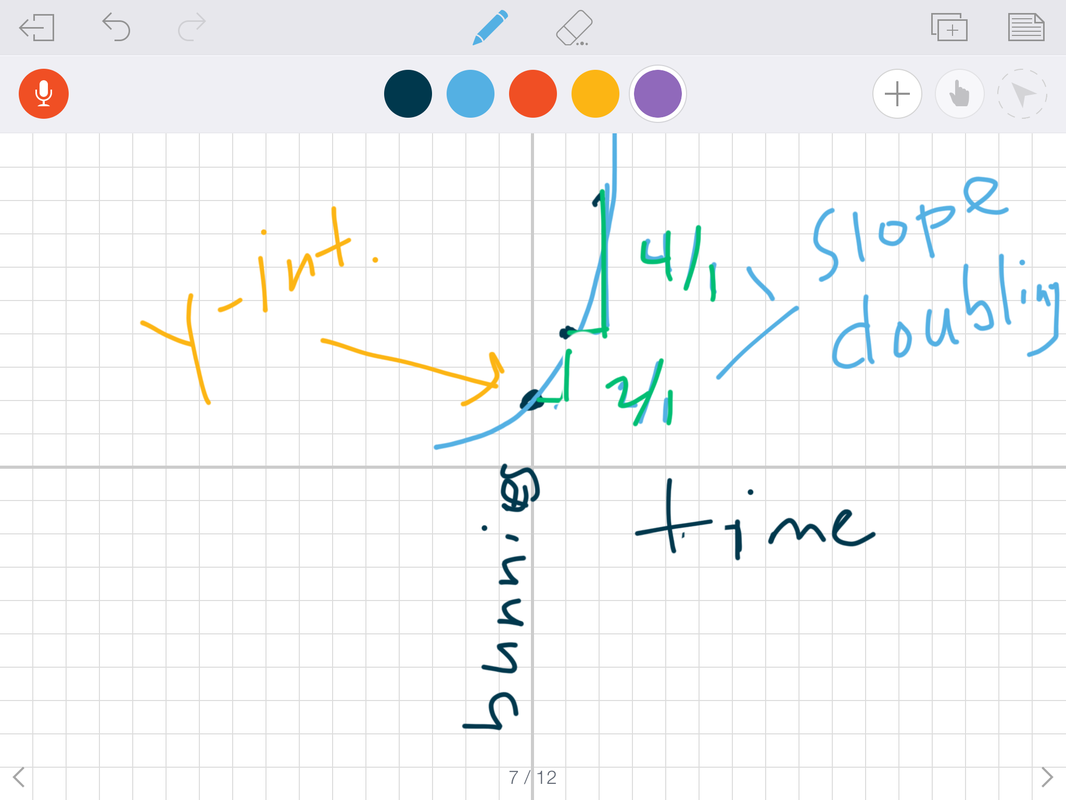
exponential graph
|
|
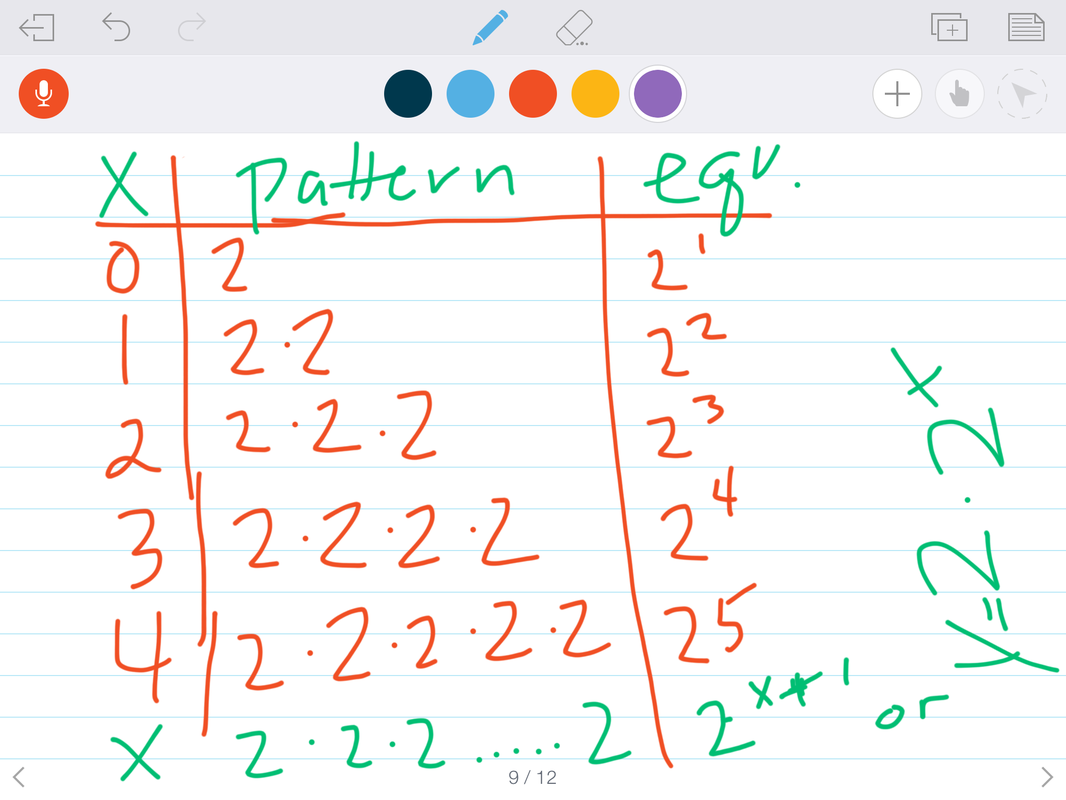
I always like to check to see if a table is linear first. After I checked an saw there was no constant rate of change through addition or subtraction, I looked for a constant rate of change through multiplication. I can tell the table doubles in the y column as the x column increases at a constant rate; therefore, I can tell this is an exponential table.
|

exponential table
|
|
This equation matches the above table and graph because it takes the form of an exponential equation. Exponential equations look like y=a(b)^x. The dependent variable appears in the equation as the exponent. This is how I remember how to write exponential equations. The a stands for the initial value and b is the growth or decay factor.
|
exponential equation
|
Parent Problem
Weeds grow like crazy in the flower beds each week. Once there is one weed (assume the weed is one square foot in surface area) in a flower bed, through pollination, the one weed's surface area will triple by next week. Then each of those weeds' surface areas will triple by the next week and so on. How many weeds will there be in two months in the flower bed? How long will it take for weeds to overtake a flower bed measuring 1250 square feet? Explain your work.


I thought this was a really good problem, but once my mom and dad got started they really didn't have too much trouble with it. I thought it was funny they started by actually drawing pictures of weeds. I did have to stop and help them by explaining the starting point is always considered week 0 in an experiment. But once they changed their table, they just kept multiplying by 3 like we did in class on our first couple of questions in class. It wasn't too hard for them with the table to figure it out.
Reflection
I learned some interesting relationships between rates and factors. I really liked the decay rate verses the decay factor. This reminds me of shopping at a sale. Rates are always in the term of a percentage, while rates are what you multiply by if you want to do the problem in one step. It is cool to understand if a sale is 20% off, I can just take the prices and multiply by 0.80 (80% is how much I am going to pay for) and I have my total cost in one step instead of the old way of calculating percents through two steps. Understanding decay rates and factors helped me to understand percentages.