Linear Relationships
I am going to show a linear relationship in three different ways. The relationship I am showing could come from a cell phone plan. This prepaid plan could start at a cost of $5 and every text you send costs an additional $2.
|
This is a linear graph. You can tell the graph is linear because it is a straight line. Also, the y-intercept is at (0,5) because that is where the blue line crosses the y-axis. I can also see there is a positive slope because when I look at the graph from left to right the graph increases as a constant rate. The graph rises two units and runs one unit. Therefore this graph has a slope of 2/1. When a graph has a slope and y-intercept it is a linear graph
|
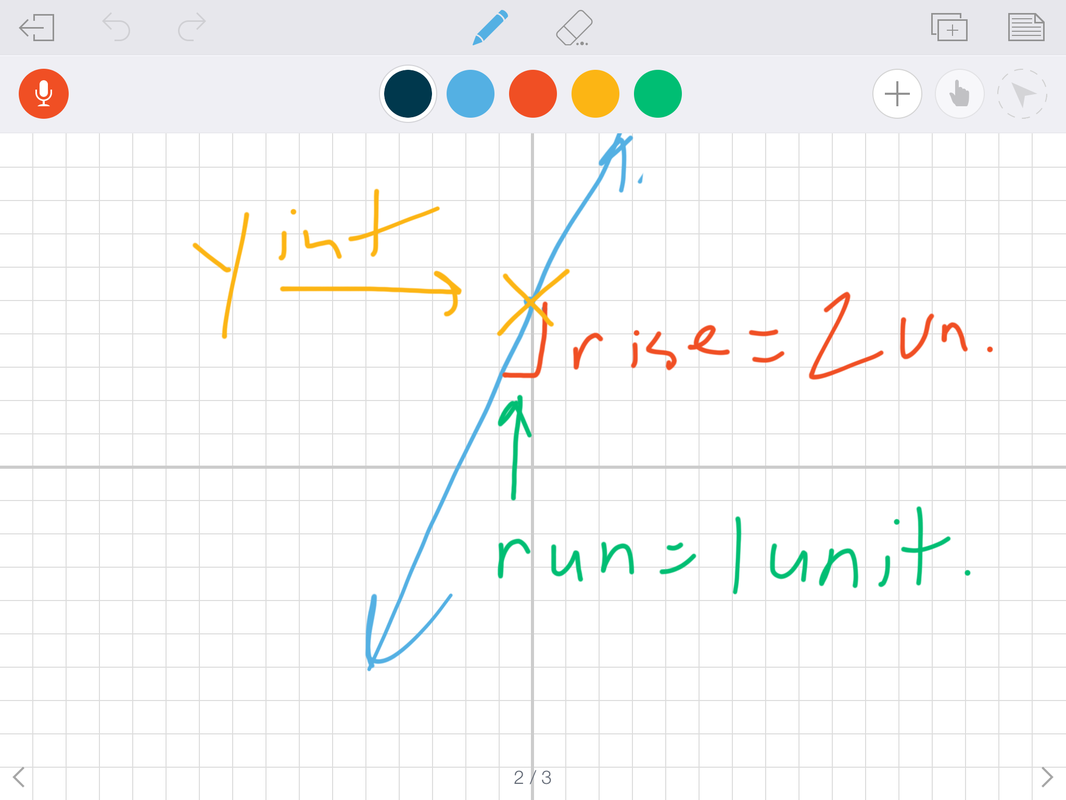
linear graph
|
|
This is a linear table. This table also shows a constant rate of change. When I look at the change in x variables, I see the table increases by one each time. When I look at the function of x, or the y variable, I see an increase of two each time. Because the ratio of x to y is 1 to 2 every time, this table is a linear table with a slope of 2/1. The y- intercept is also on the table where x=0. The y-intercept if 5. This table matches the graph above. The negative x values do not make sense for the cell phone plan, so we can ignore the negatives in the real world.
|

linear table
|
|
This is the equation that matches the graph and table above. The easiest form to write a linear equation in is slope intercept form. Slope intercept form is y=mx+b. Y stands for the dependent variable, m is the slope, x is the independent variable and b is the y intercept. In function form we switch the y for f(x) and then I plugged in the slope and y-intercept from above into the m and the b to make this equation.
|
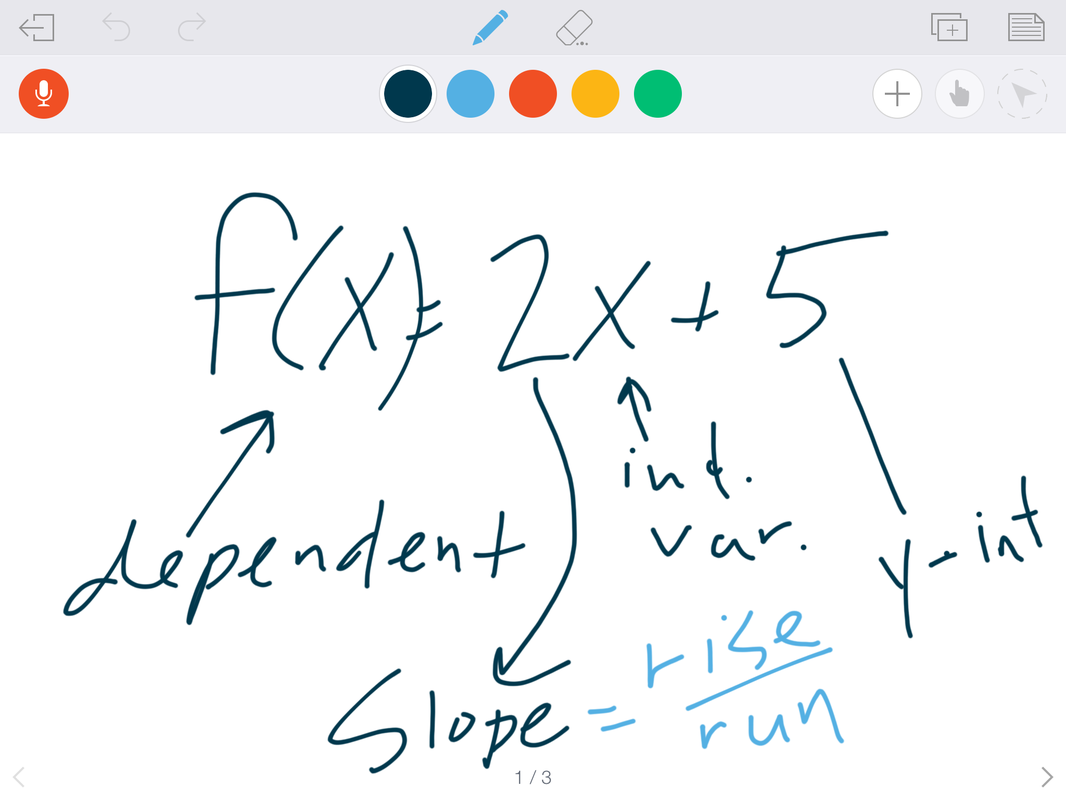
linear equation
|
Parent Problem
David Anderson is having a canned food drive at home basketball games and kept records of the cans collected and the attendance at the games. The records are shown in the table below.
- Graph the points and determine a linear model for the data.
- How many containers will be recycled is 125 people attend the game. Use your model to explain your estimate.
- How many people attended the game if 125 containers were collected. Use your model to explain your estimate.
- Use the points (200, 100) and (50, 25) to write an equation in the form of y=mx+b for your model. Show your work.
- Explain what the slope and y-intercept tell you about the relationship between the number of containers and attendance.


My mom and dad said this problem was pretty easy but I had a lot of steps in it. They did not remember "rise over run". They said they could remember the saying but had no idea what it meant and drew a whole bunch of question marks. I told them we are not allowed to not try the problem, but I helped them. I had to calculate the slope for them to fill our the equations and they had to look up what the y, m, x, and b stood for online. I figured that was ok because we research some in class too.
Reflection
I learned that all linear equations are not perfect. In the real world data may resemble a linear relationship, but not be exact. When this happens we use a linear model to represent the data and then make predictions from the model. The model allows us to do calculations and the answers we get are close estimates of what could really happen. It is neat not all math is perfect and we are allowed to make assumptions. However, there are tools to see how accurate our assumptions are, such as residuals and correlation coefficients.